
The easy part of BI is usually drawing a chart.
Pick a few columns, choose a bar or line chart, add color and tooltips, and you can get something convincing in minutes. The harder question is whether the calculation underneath deserves that confidence.
That changed how I think about LightBI. The useful question is no longer “which chart should I draw?” but “do I understand this data well enough to draw one safely?”
Charts are the easy part
A sales export may contain fields named Total, Amount, Revenue or simply Value. Names are not enough. If each row is a sale line, summing revenue may be fine. If each line repeats an order total, the same SUM can multiply revenue while the dashboard still looks perfectly reasonable.
That is why row grain matters. Knowing what one physical row represents is a safety boundary, not an academic detail.
If you do not know what a row represents, do not rush to aggregate what sits on that row.
Recognition is not permission
LightBI deliberately separates semantic recognition from execution permission. A field may have strong evidence that it represents revenue while still being unsafe to aggregate, compare across periods, or combine with another source.
Before execution, the system still has to reason about grain, source scope, relationships, missing evidence and the requirements of the requested metric. Sometimes the right answer is simply: there is not enough evidence yet.
Understand first, execute second
Inspect the physical source.
Resolve business signals with evidence.
Determine grain, keys and unresolved ambiguity.
Expose only supported analytical perspectives.
Execute against the required source scope.
Carry lineage and caveats into charts, Deep BA and exports.
The interface should become simpler over time. The evidence model underneath should not become simpler by pretending difficult questions do not exist.
Local-first is more than a privacy slogan
Operational data often should not leave the machine just to produce a chart. Keeping analysis local also keeps source understanding and execution close to the original evidence. Product telemetry, licensing and distribution can live elsewhere without absorbing business files, column names, query results or BA findings.
A useful chart keeps its evidence attached
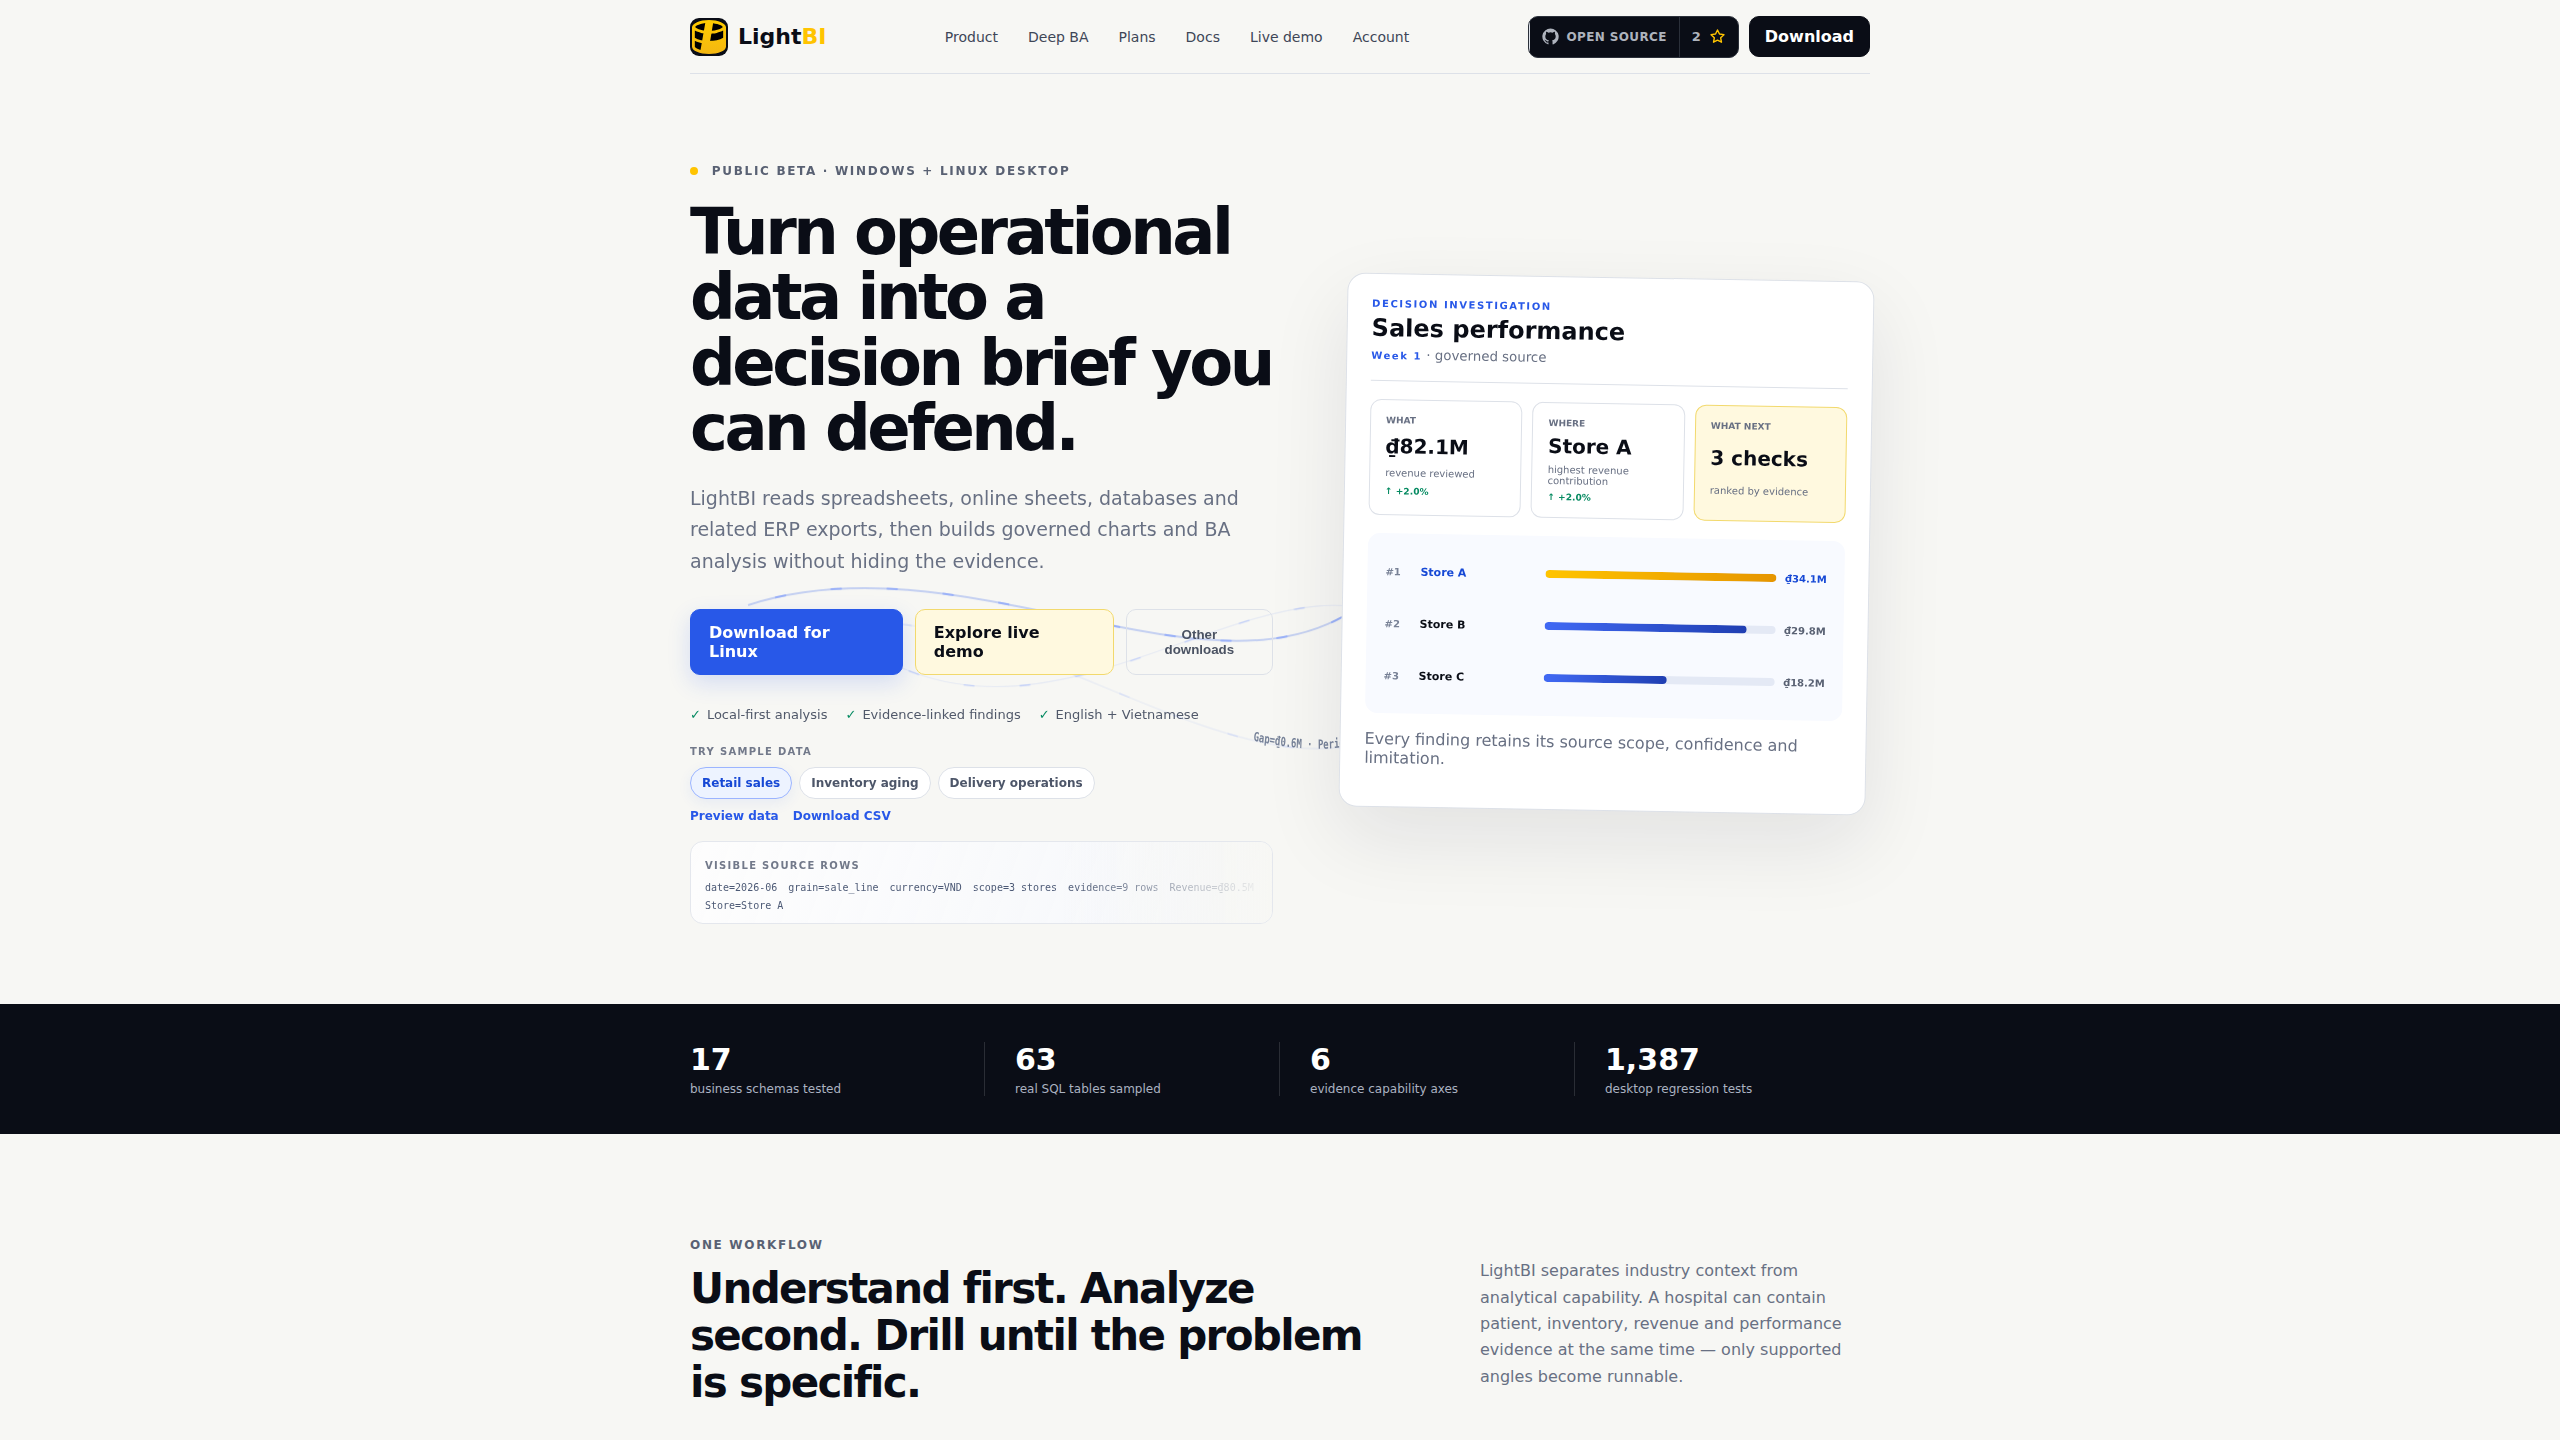
I do not want LightBI to stop at “revenue fell 6%.” The useful path continues: where did it fall, which source scope was used, what caveats remain, and which rows are behind the selected chart point?
That is why drill-through, Deep BA and export keep converging on the same rule: conclusions should not be detached from the evidence that produced them.
The user should not need to learn the machinery
People should not have to study semantic resolution or metric preflight before opening an Excel file. Those concepts exist so the product can be safer while the user experience becomes calmer.
The goal is still ordinary: open the data, understand what it says, find what matters, and carry the result into a conversation with enough evidence to defend it.
No approved comments yet.